Bitcoin realized price signals reveal key market support levels and investor behavior during volatile cycles and global uncertainty.
Understanding Bitcoin’s Realized Price Signals
When markets become uncertain, many investors only look at the current Bitcoin price. They watch the chart moving up or down and assume that tells the full story. But professional investors often study a different metric called the realized price, which gives a deeper understanding of how the market is behaving beneath the surface.
The realized price represents the average price at which all Bitcoin currently in circulation last moved on the network. Instead of focusing on speculative market trading, this metric reflects the real economic activity of Bitcoin holders. By analyzing this data, investors can see whether the market is overheated, undervalued, or approaching major support levels.
Short-Term vs Long-Term Holders
Another important concept connected to realized price is the difference between short-term holders and long-term holders. Short-term holders are typically investors who moved their Bitcoin within the last 155 days. These participants are usually more sensitive to price movements and market sentiment.
Long-term holders behave very differently. These are investors who have held their Bitcoin for more than 155 days without selling or moving their coins. Historically, this group has shown stronger conviction and tends to accumulate during periods of fear rather than panic selling. Because of this behavior, long-term realized price often acts as a strong support zone for the market.
Key Bitcoin Support Zones
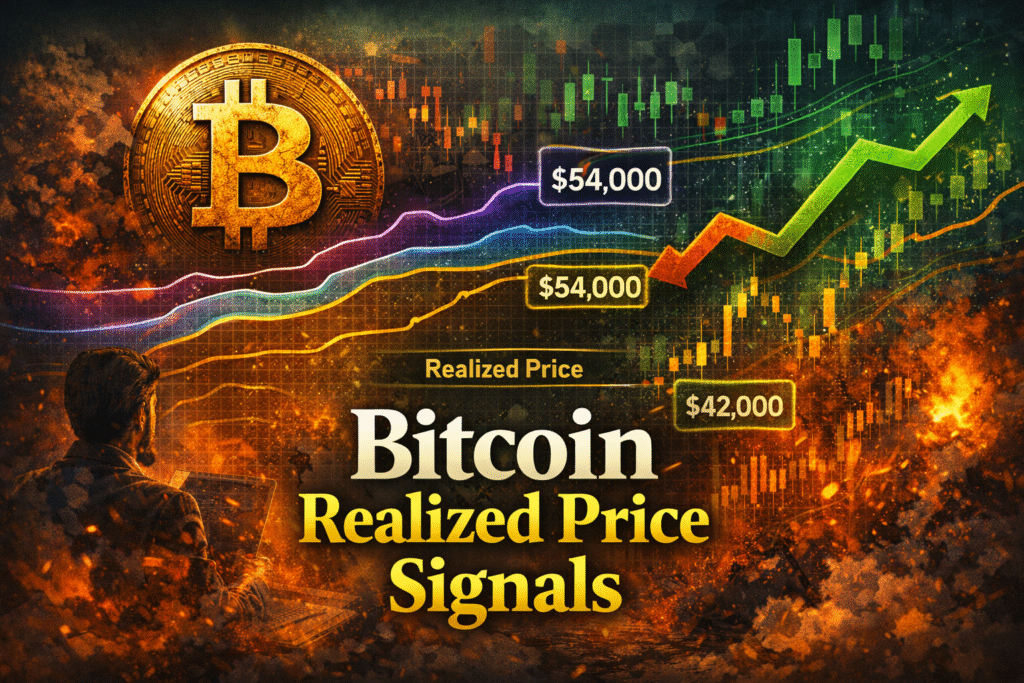
Looking at realized price data reveals important support levels where the market may stabilize. Based on the current network metrics, one key level sits around $54,000, which represents a major realized price support zone. If the market were to fall below this level, the next major area investors watch sits closer to $42,000.
These levels do not guarantee immediate rebounds, but they provide valuable insight into where long-term investors may begin accumulating more aggressively. Historically, when Bitcoin approaches bitcoin realized price signals, it often enters a zone where strong buyers step in. This is why many experienced investors pay close attention to these metrics during volatile periods.
I explain these realized price charts in detail in this YouTube video where you can see how the data works visually.
Why These Metrics Matter
Understanding realized price changes how investors think about Bitcoin cycles. Instead of reacting emotionally to every price drop, you begin evaluating where the network’s economic activity actually sits. This perspective helps investors focus on long-term accumulation rather than short-term panic.
If you want to understand how Bitcoin’s supply structure, investor behavior, and market cycles work together, the Bitcoin Essentials course explains these concepts in a clear and structured way.
Final Perspective
Bitcoin markets will always experience volatility. But metrics like realized price show that beneath the surface, long-term investors continue to build positions. When you understand how these indicators work, price swings begin to look less like chaos and more like part of a larger cycle.
The key is learning to read the signals that experienced investors track rather than reacting only to headlines.
Need help building your Bitcoin strategy?
Message me directly on WhatsApp.
+971 56 739 9526