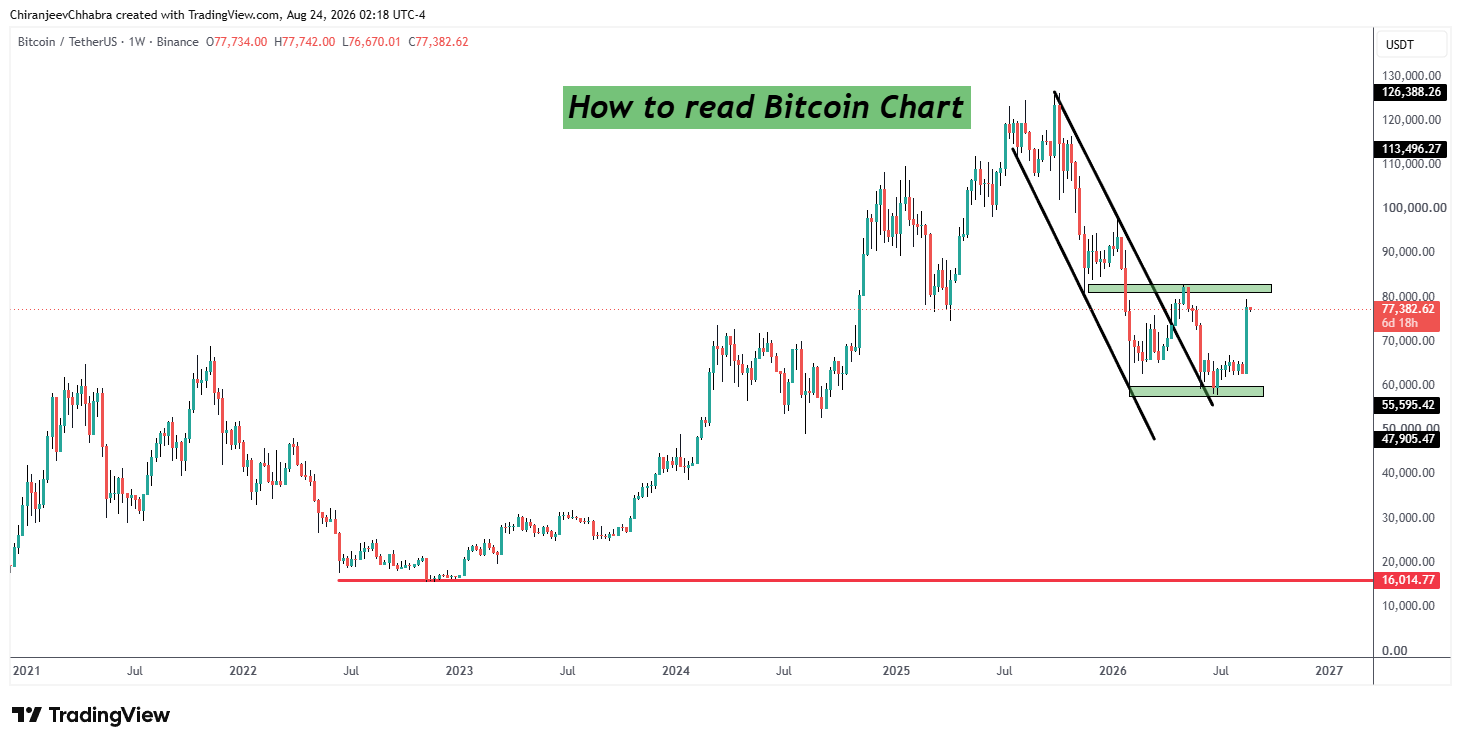
If you want to trade Bitcoin in the UAE, reading Bitcoin charts is the single most important skill you need to develop. Most UAE residents in Abu Dhabi and Dubai who lose money trading Bitcoin are not losing because of bad luck — they are losing because they cannot read what the chart is telling them. This guide by Azad Money — Abu Dhabi’s Bitcoin educator — explains exactly how to read Bitcoin charts as a complete beginner in the UAE.
What is a Bitcoin Chart?
A Bitcoin chart is a visual representation of Bitcoin’s price over time. The horizontal axis shows time — hours, days, weeks, months. The vertical axis shows Bitcoin’s price in USD or AED. Every point on the chart tells you what Bitcoin was worth at that specific moment. By studying how price has moved in the past, you can develop a structured approach to understanding where price might move in the future.
The most widely used platform for reading Bitcoin charts in the UAE is TradingView — a free web-based charting platform that gives you access to Bitcoin’s full price history across every timeframe.
Candlestick Charts — The Foundation of Bitcoin Chart Reading
The most common type of Bitcoin chart is the candlestick chart. Each candlestick represents a specific time period — one hour, four hours, one day, one week. Each candlestick tells you four pieces of information about that time period — the opening price, the closing price, the highest price reached, and the lowest price reached.
A green candlestick means Bitcoin’s price closed higher than it opened — buyers were in control. A red candlestick means Bitcoin’s price closed lower than it opened — sellers were in control. The body of the candle shows the distance between open and close. The thin lines above and below called wicks show how far price moved beyond the open and close during that period.
Reading candlesticks is the foundation of Bitcoin chart analysis. Before learning any indicator or tool, you must understand what each candle is telling you about who is in control — buyers or sellers.
Support and Resistance — The Most Important Concept in Bitcoin Chart Reading
Support is a price level where Bitcoin has repeatedly bounced upward. Resistance is a price level where Bitcoin has repeatedly been rejected downward. These levels exist because of human psychology — traders remember where price reacted before and make decisions at the same levels again.
For UAE residents learning to read Bitcoin charts, identifying key support and resistance levels is the single most important skill. When Bitcoin approaches a strong support level, it is often a higher probability buying opportunity. When Bitcoin approaches a strong resistance level, it is often a point of caution.
One of the most reliable principles in Bitcoin chart reading is that when a resistance level is broken, it often becomes support on the next pullback — and when a support level is broken, it often becomes resistance. Understanding this principle alone puts you ahead of most retail traders in the UAE.
Timeframes — Which Chart to Read
Bitcoin charts are available across multiple timeframes. Each timeframe tells a different story about what Bitcoin is doing. The weekly and daily charts show the bigger picture — the overall trend, major support and resistance levels, and Bitcoin’s long-term market structure. These are the most important charts for UAE residents who want to understand Bitcoin’s direction over weeks and months.
The four-hour chart helps you refine your analysis — identifying medium-term levels and trends within the larger daily picture. The one-hour and fifteen-minute charts are used purely for timing entries and exits — they show short-term price movements within the context of the larger trend.
The most common mistake UAE beginners make is starting with the fifteen-minute chart — this creates confusion and noise. Always start with the daily chart to understand the big picture, then work down to lower timeframes for entry timing.
Key Technical Indicators for Bitcoin Chart Reading
RSI — Relative Strength Index
RSI measures how overbought or oversold Bitcoin is at any given moment on a scale of 0 to 100. An RSI above 70 means Bitcoin may be overbought and due for a pullback. An RSI below 30 means Bitcoin may be oversold and due for a bounce. RSI is most useful when combined with support and resistance analysis — not as a standalone signal.
Moving Averages
Moving averages smooth out Bitcoin’s price action and help you identify the overall trend direction. The 200-day moving average is the most widely watched level by Bitcoin traders globally. When Bitcoin is trading above the 200-day moving average, the long-term trend is considered bullish. When trading below it, the long-term trend is considered bearish. The 50-day moving average is used for medium-term trend analysis. Crossovers between the 50 and 200-day moving averages — known as the golden cross and death cross — are among the most watched signals in Bitcoin chart analysis.
MACD — Moving Average Convergence Divergence
MACD helps identify momentum changes in Bitcoin’s price. When the MACD line crosses above the signal line, it can indicate increasing bullish momentum. When it crosses below, it can indicate increasing bearish momentum. MACD is most useful on daily and weekly timeframes for UAE residents looking at Bitcoin’s medium to long-term direction.
Volume
Volume tells you how many Bitcoin transactions occurred during a specific period. High volume during a price move confirms the move. Low volume during a price move suggests it may not be sustainable. If Bitcoin breaks above a resistance level on high volume, that breakout is more likely to be genuine. If it breaks on low volume, it may reverse.
On-Chain Analysis — Beyond the Chart
Reading Bitcoin price charts is important. But the most advanced Bitcoin traders in the UAE combine chart analysis with on-chain data — information read directly from Bitcoin’s blockchain. On-chain analysis shows you what large holders are doing, how much Bitcoin is moving off exchanges into cold storage, and what the network data tells you about Bitcoin’s supply and demand dynamics.
On-chain analysis is one of the most powerful tools available to Bitcoin traders in 2026 — and one of the most underutilized by UAE residents who focus only on price charts. At Azad Money we teach both chart reading and on-chain analysis as part of our Bitcoin trading coaching in Abu Dhabi.
The Most Important Rule for Bitcoin Chart Reading in UAE
Charts give you probability, not certainty. No chart setup guarantees a profitable trade. The goal of reading Bitcoin charts is not to predict the future — it is to identify high-probability setups where the potential reward justifies the risk. Every trade you make in UAE must have a clear entry, a clear stop loss, and a clear target. Without these three elements you are not trading — you are gambling.
Learn Bitcoin Chart Reading in Abu Dhabi with Azad Money
Azad Money offers live one-on-one Bitcoin trading coaching in Abu Dhabi and online across UAE — covering Bitcoin chart reading, on-chain tools, risk management, and a custom Bitcoin indicator developed by Azad Money specifically for identifying high-probability Bitcoin trading setups.
Our coaching is available in English, Hindi and Urdu — making us the only Bitcoin trading educator in Abu Dhabi serving the full diversity of the UAE’s expat community.
Start with our Bitcoin Essentials course for only $10 to build your Bitcoin foundation first.
Then message us on WhatsApp to discuss our live one-on-one Bitcoin trading coaching sessions: Chat with Azad Money on WhatsApp