Bitcoin technical analysis is the skill that separates UAE residents who trade Bitcoin profitably from those who lose money guessing price direction. If you are in Abu Dhabi or Dubai and want to learn Bitcoin technical analysis from someone who actually trades Bitcoin and teaches it locally — this guide by Azad Money is your starting point.
What is Bitcoin Technical Analysis?
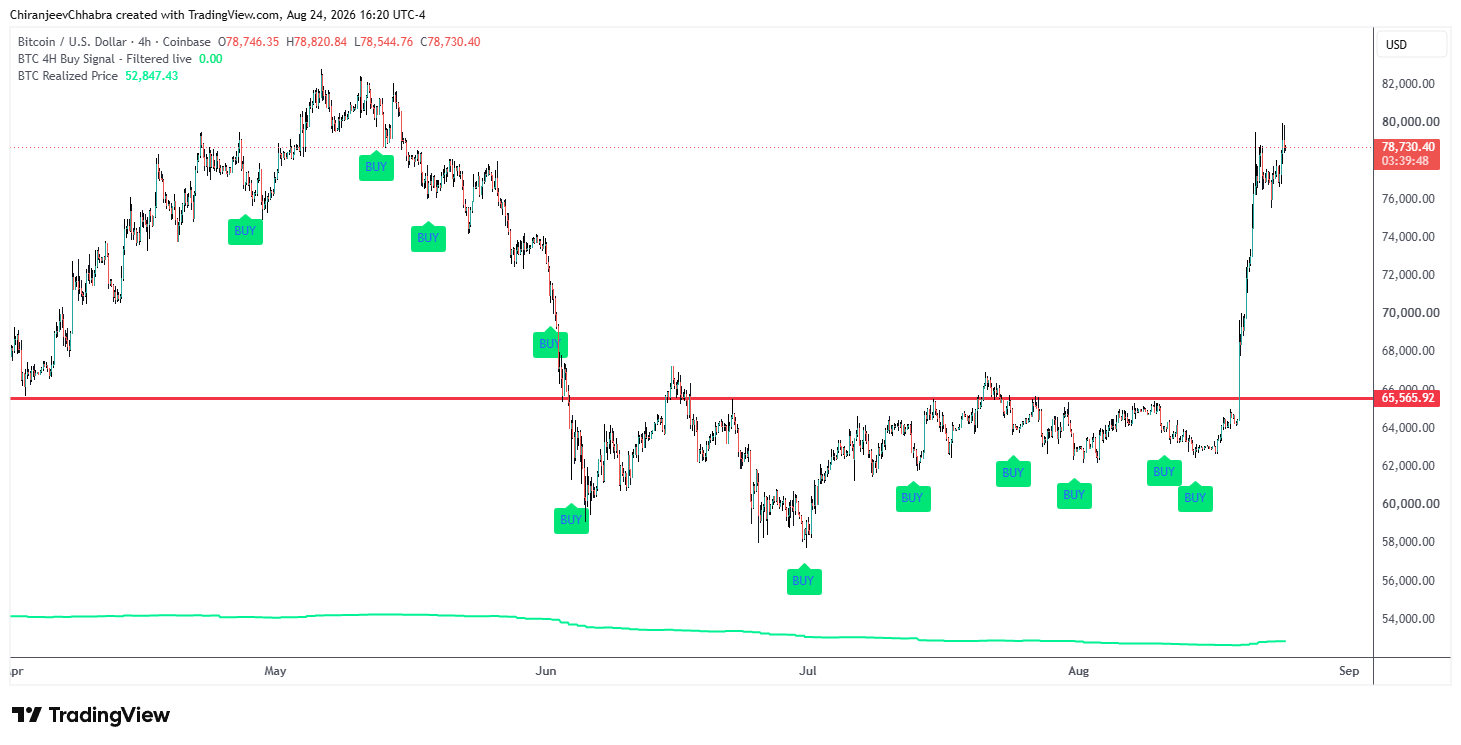
Bitcoin technical analysis — commonly called TA — is the practice of studying Bitcoin’s historical price movements on charts to identify patterns, trends, and high-probability trading setups. Unlike fundamental analysis which focuses on Bitcoin’s value as a monetary network, technical analysis focuses purely on price action — what buyers and sellers are doing right now and what they are likely to do next.
In Abu Dhabi and Dubai, Bitcoin technical analysis is increasingly in demand as more UAE residents move beyond simply buying and holding Bitcoin and want to understand how to actively manage their Bitcoin positions with discipline and strategy.
Why Bitcoin Technical Analysis is Different from Crypto TA
Most technical analysis courses and guides in UAE teach generic crypto TA — the same principles applied to Bitcoin, Ethereum, altcoins, and thousands of other tokens. Azad Money teaches Bitcoin-only technical analysis. This matters because Bitcoin’s market structure, liquidity, and price cycles are fundamentally different from altcoins.
Bitcoin has the deepest liquidity of any digital asset — meaning large institutional players like Abu Dhabi’s Mubadala, BlackRock, and Strategy are actively buying and selling Bitcoin. This institutional participation creates more reliable technical levels and patterns than altcoin charts where manipulation is more common and liquidity is thinner. For UAE residents serious about trading, Bitcoin-only TA is a more reliable and structured discipline than generic crypto TA.
The Foundation of Bitcoin Technical Analysis — Market Structure
Market structure is the most important concept in Bitcoin technical analysis. Before looking at any indicator or tool, you must understand what Bitcoin’s chart is telling you about the overall direction of price.
Bitcoin moves in a series of higher highs and higher lows during an uptrend — each peak is higher than the last and each pullback holds above the previous low. Bitcoin moves in a series of lower highs and lower lows during a downtrend — each rally fails at a lower level than the previous one. Identifying which structure Bitcoin is currently in on the daily and weekly timeframe is the first step in every technical analysis session.
Most UAE residents who lose money trading Bitcoin are fighting the structure — trying to buy in a downtrend or sell in an uptrend. Understanding market structure prevents this fundamental mistake.
Key Bitcoin Technical Analysis Tools Used in Abu Dhabi
Support and Resistance Levels
Support is a price level where buying has repeatedly exceeded selling — Bitcoin bounces from this level. Resistance is a price level where selling has repeatedly exceeded buying — Bitcoin gets rejected at this level. Identifying key support and resistance on Bitcoin’s daily and weekly chart is the foundation of every trade setup in Abu Dhabi and across the UAE.
Trend Lines
Trend lines connect a series of price highs or lows to show the direction of Bitcoin’s momentum. A valid trend line requires at least three touches — the more times price has respected a trend line, the more significant it becomes. When Bitcoin breaks a major trend line on high volume, it often signals a significant change in market direction.
Moving Averages
The 200-day moving average is the most widely watched technical level in Bitcoin. When Bitcoin is above the 200-day MA, the long-term trend is bullish. When below, it is bearish. Abu Dhabi’s institutional Bitcoin buyers — including Mubadala — likely use the 200-day MA as one of their primary accumulation signals. The 50-day MA combined with the 200-day MA gives you the golden cross and death cross — two of the most significant long-term signals in Bitcoin technical analysis.
RSI — Relative Strength Index
RSI measures momentum and identifies overbought and oversold conditions. On the weekly Bitcoin chart, RSI above 80 has historically marked major Bitcoin tops. RSI below 30 on the weekly chart has historically marked major Bitcoin bottoms — some of the best long-term buying opportunities for UAE residents. RSI is most powerful when combined with key support and resistance levels rather than used as a standalone signal.
Volume Analysis
Volume confirms price moves. When Bitcoin breaks above a major resistance level on high volume, the breakout is more reliable. When price moves on low volume, it may be a false move. UAE residents learning Bitcoin technical analysis should always check volume before acting on any price pattern or breakout.
Bitcoin Price Cycles and Technical Analysis
One of the most powerful aspects of Bitcoin technical analysis is understanding Bitcoin’s four-year halving cycle. Bitcoin’s supply is cut in half approximately every four years — an event called the halving. Historically each halving has been followed by a significant bull market 12-18 months later. Understanding where Bitcoin currently sits within its four-year cycle gives UAE traders a powerful macro framework for their technical analysis decisions.
The halving cycle does not guarantee price movements — but it provides important context for understanding Bitcoin’s long-term technical picture that no other asset offers.
On-Chain Analysis — The Advanced Layer of Bitcoin TA
Beyond price charts, Bitcoin technical analysis in 2026 increasingly incorporates on-chain data — information read directly from Bitcoin’s blockchain. On-chain metrics like exchange flows, miner behavior, long-term holder positions, and realized price show you what is actually happening with Bitcoin at the network level — information that pure chart reading cannot provide.
Azad Money is one of the only Bitcoin educators in Abu Dhabi teaching on-chain analysis alongside traditional chart reading. This combination gives our students a significantly more complete picture of Bitcoin’s market dynamics than chart-only analysis provides. We also teach our own custom Bitcoin indicator — developed specifically to identify high probability Bitcoin trading setups based on both price action and on-chain confirmation.
The Most Common Bitcoin TA Mistakes Made by UAE Traders
Trading on low timeframes without understanding the daily and weekly structure — the fifteen-minute chart is noise without context from higher timeframes. Using too many indicators — the best Bitcoin technical analysis is clean and simple. Structure, key levels, volume, and one or two confirmation tools are enough. Ignoring risk management — even the best technical setups fail regularly. Without a clear stop loss and defined risk per trade, one bad trade can erase months of gains. Trading based on emotion — fear and greed destroy more accounts than bad analysis. Technical analysis only works when combined with disciplined execution.
Learn Bitcoin Technical Analysis in Abu Dhabi with Azad Money
Azad Money offers live one-on-one Bitcoin technical analysis coaching in Abu Dhabi and online across UAE. Our trading sessions cover Bitcoin market structure, key support and resistance, moving averages, RSI, volume analysis, on-chain tools, and our custom Bitcoin indicator — all taught personally by Azad in English, Hindi or Urdu.
No recorded videos. No group sessions. Just live, personal, Bitcoin-only technical analysis coaching tailored to your level and goals.
Start with our Bitcoin Essentials course for only $10 to build your Bitcoin foundation.
Then message us on WhatsApp to book your live Bitcoin technical analysis coaching session in Abu Dhabi: Chat with Azad Money on WhatsApp