BTC prices are falling and the noise around it never stops. Some say it is the end, some call it another dip. Instead of guessing, it makes sense to look at on chain data. Two charts tell the real story. Adjusted SOPR and the Realized Profit Loss Ratio.
BTC prices are falling and here is why Adjusted SOPR matters
Adjusted SOPR shows whether people are selling coins in profit or in loss.
When the SOPR line goes below 1, it means investors are selling their coins in loss.
When the orange line climbs above 1 and holds, it confirms short term bullish momentum.
In plain words
Below 1 means fear and weak hands
Above 1 means confidence and recovery
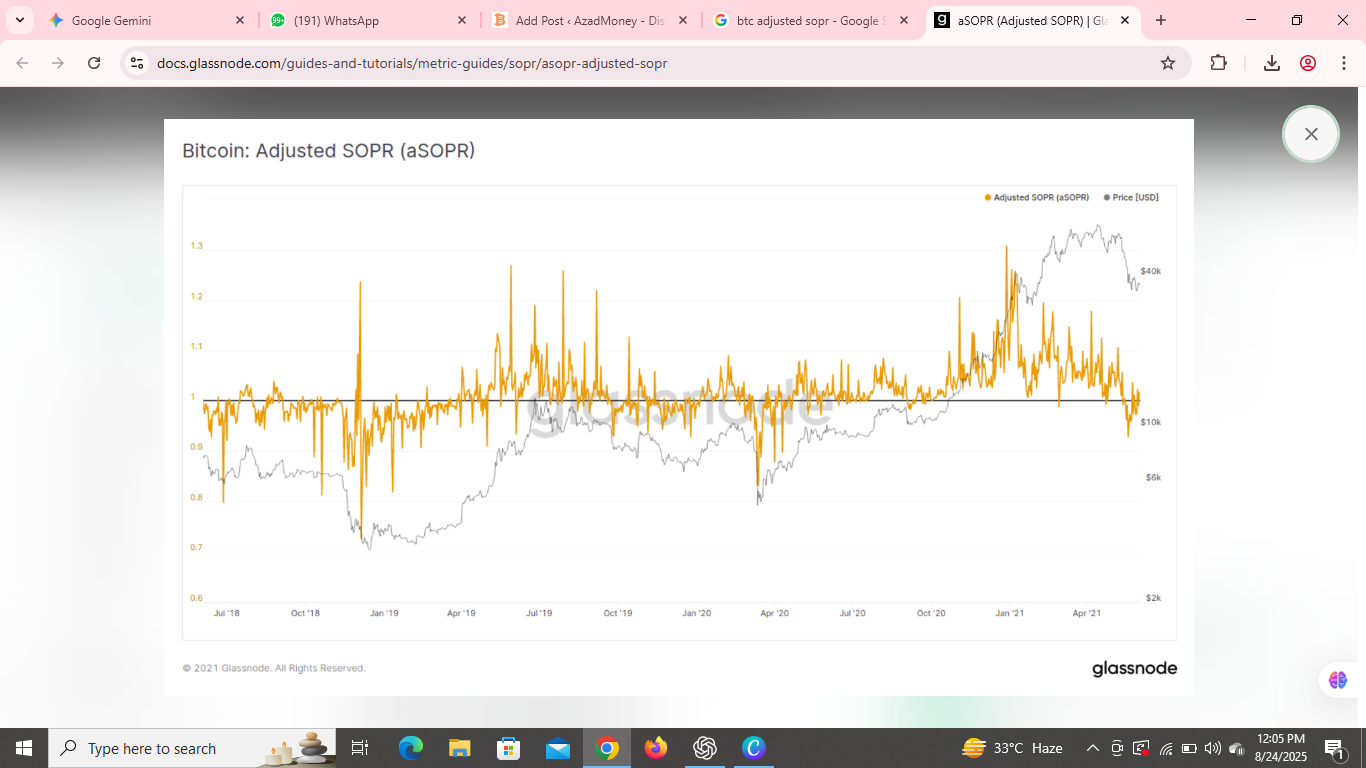
You can track live SOPR charts on Glassnode.
BTC prices are falling and Realized Profit Loss Ratio explains more
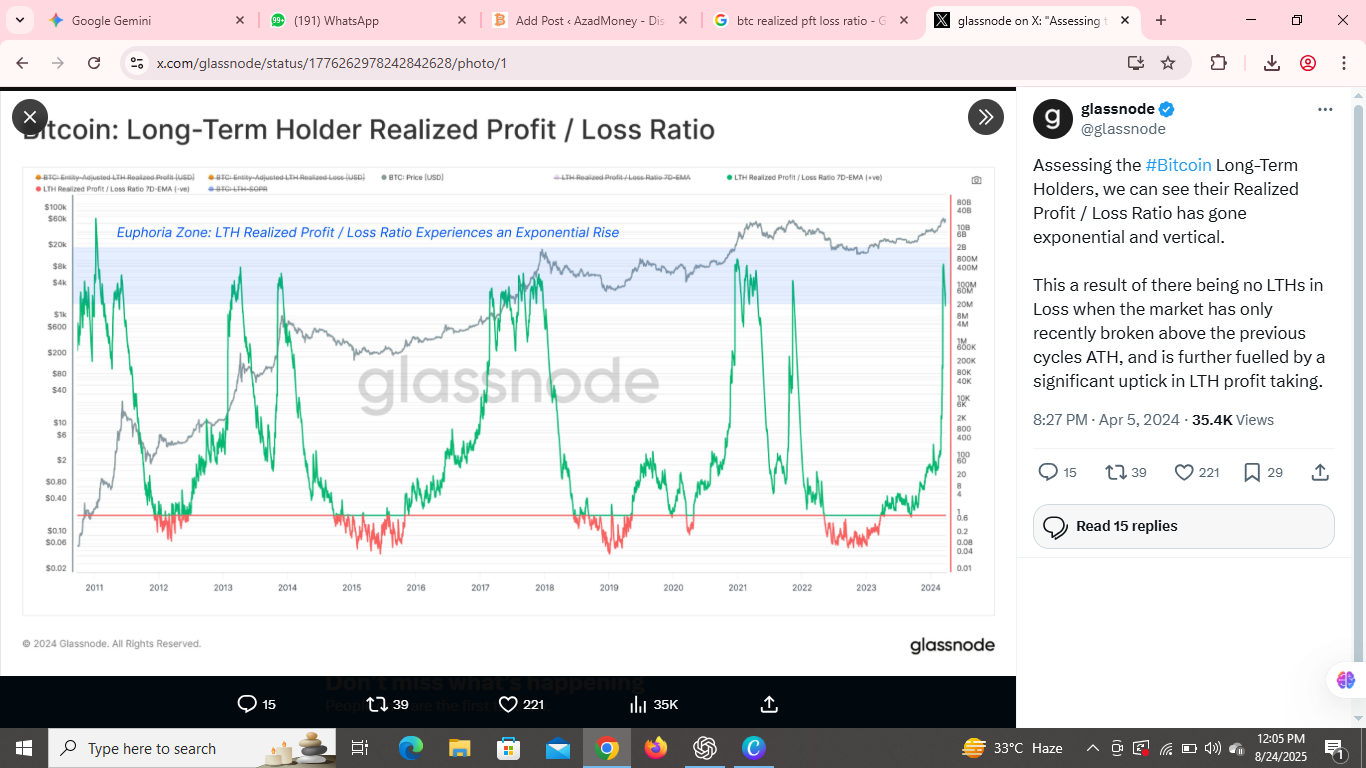
The Realized Profit Loss Ratio measures the gap between realized price and market price.
When the line is above 1, it shows coins are sold in profit and the chart turns green.
When the line is below 1, it shows coins are sold in loss and the chart turns red.
Red zones are often good buying opportunities. It usually means weak hands are selling while stronger holders are accumulating quietly.
For more context you can join our Bitcoin Essentials Course
What these charts mean when BTC prices are falling
Charts will not tell you the price tomorrow. But they reveal the mindset of the market.
Are people scared or calm
Are they selling at loss or booking profit
Is this dip danger or a chance
The key insight is clear. Falling BTC prices do not always signal weakness. Sometimes they highlight the best opportunities.