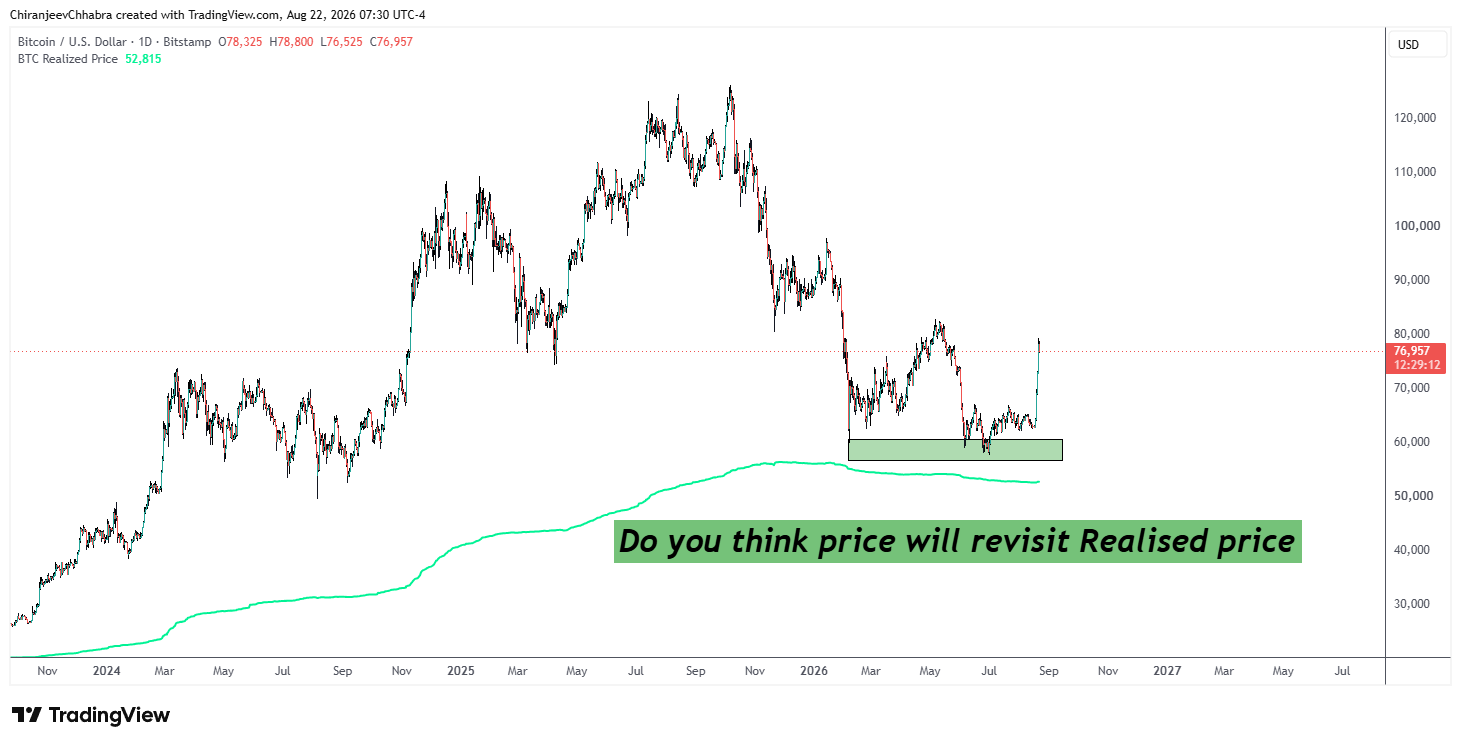
If you’ve read our guide on Bitcoin halving cycles, you already know Bitcoin moves in roughly four-year cycles. The next question every trader asks is harder: how do you actually identify when a cycle has bottomed, rather than guessing? One of the most reliable tools traders use is the realized price.
What Is Realized Price?
Realized price isn’t the market price you see on an exchange — it’s the average price at which every coin currently in circulation last moved on-chain. In simple terms, it represents the aggregate cost basis of the entire market. When Bitcoin’s market price falls toward or below the realized price, it means the average holder is now underwater — historically a zone where selling pressure exhausts itself and long-term accumulation begins.
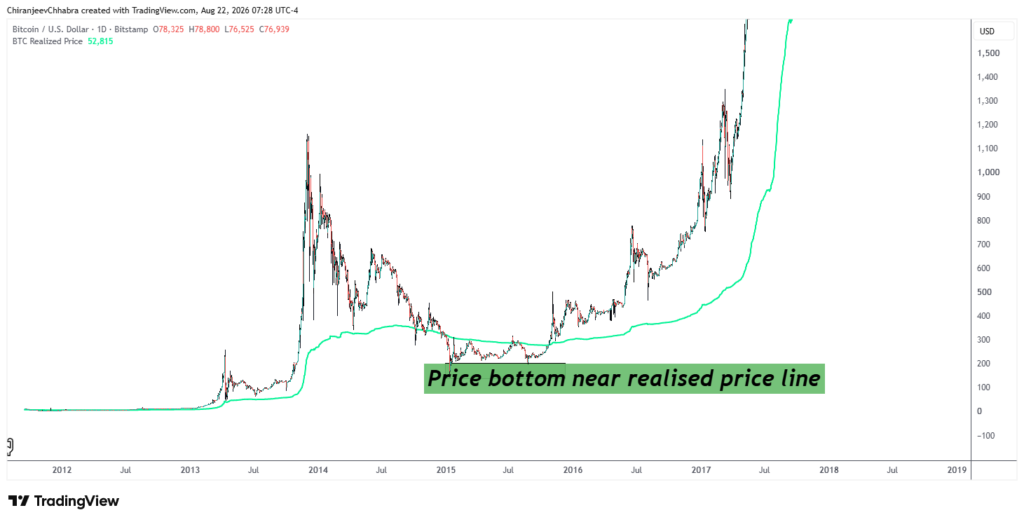
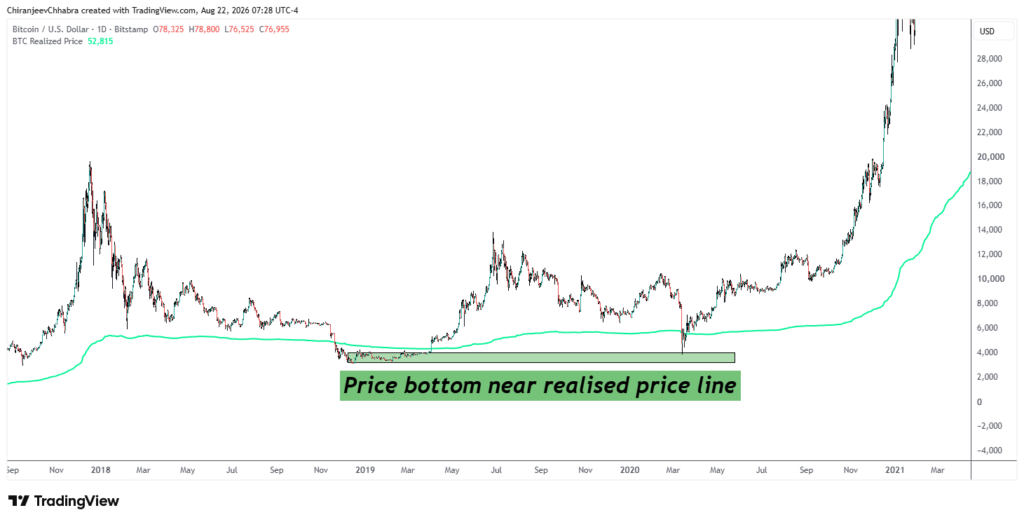
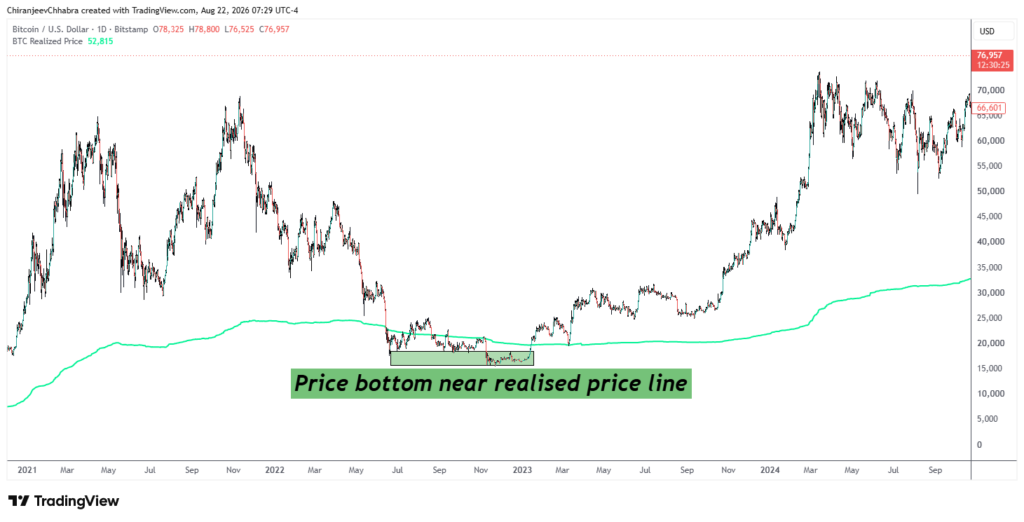
What the Chart Shows
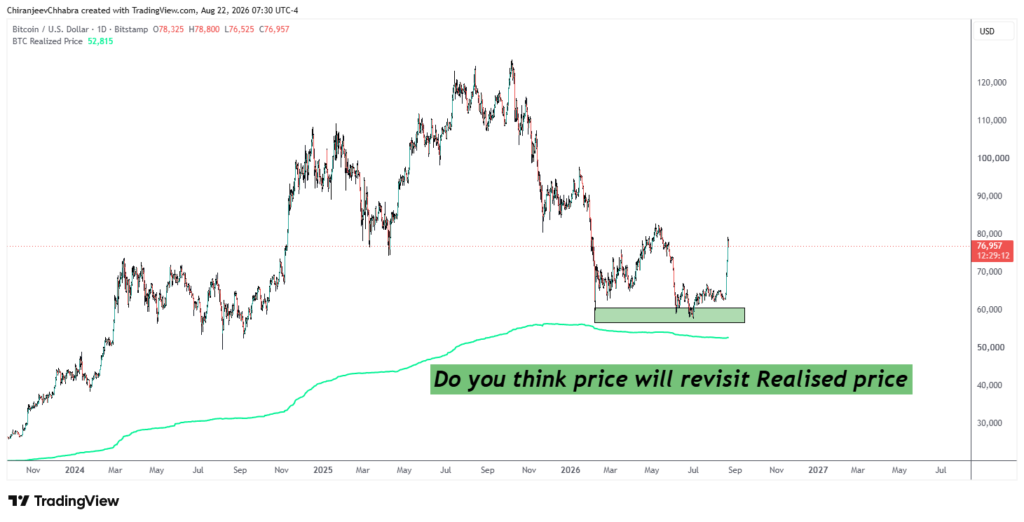
Looking at Bitcoin’s price history against realized price, a consistent pattern emerges: in the 2018–2019 bear market, the 2020 COVID crash, and the November 2022 bottom, Bitcoin’s price fell to a level close to (or briefly below) its realized price before turning higher into the next cycle. It’s not a perfectly precise timing tool, but as a zone rather than an exact signal, it’s been one of the more consistent indicators across three completed cycles.
Where We Are Right Now (as of Aug 22, 2026)
As of this writing, Bitcoin is trading around $76,957 while realized price sits near $52,835. That’s a meaningful gap — in this current cycle, price has not yet revisited the realized price line the way it did in the previous three cycles. Whether that happens depends on how the rest of this cycle plays out; it’s a live, open question rather than a settled one.
The 200-Day Moving Average, Alongside Realized Price
The 200-day moving average is a second layer often read alongside realized price. When market price is trading well above both the 200 DMA and realized price, the market is typically in an expansion phase. When price compresses down toward both lines simultaneously, that convergence has historically marked periods of exhaustion rather than continuation. Neither indicator works in isolation — traders who rely on realized price generally use it as one input in a broader framework, not a standalone buy signal.
Why This Matters for UAE Traders Specifically
Cycle-bottom indicators like this matter more when you’re trading with a tax-free capital gains environment, because your edge comes entirely from decision quality, not from tax efficiency covering for weak entries. Knowing whether you’re buying near a historically significant support zone — or chasing a move well above it — is the difference between a structural entry and a reactive one.
Where to Go From Here
Where you go next depends on where you are in your Bitcoin journey:
New to Bitcoin? Start with the fundamentals in our Bitcoin Essentials course — realized price and on-chain indicators make a lot more sense once the basics are solid.
Want to learn how to read on-chain indicators like this yourself? Message us on WhatsApp at wa.me/971567399526 to talk through our five-session Bitcoin trading coaching package.
Want a personalized read on where we are in the current cycle right now? Book a one-on-one coaching call and we’ll walk through the current data together.